analytics-portfolio
Tableau Visualizations — Clinton Township Elections
A collection of interactive Tableau dashboards analyzing voter trends and geographic distributions in Clinton Township, Michigan.
These visualizations were developed to support data-driven decision-making in election planning, resource allocation, and turnout analysis.
Precinct Density Map (November 2024)
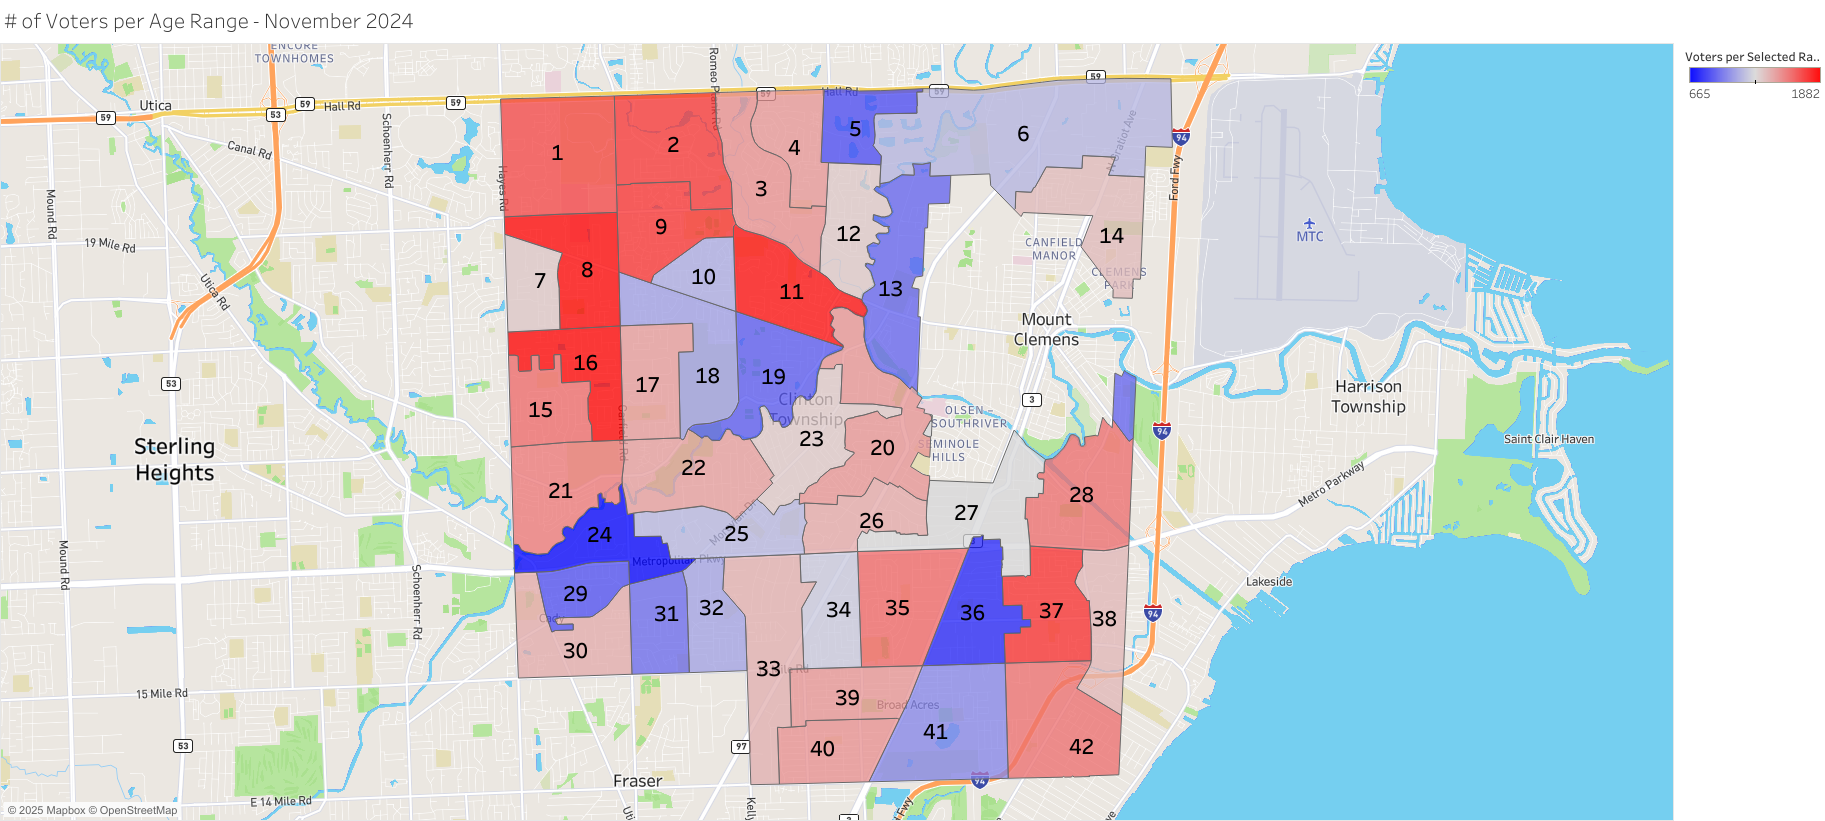
This dashboard visualizes precinct-level voter density across Clinton Township for the November 2024 General Election.
It highlights geographic patterns in registration, showing higher-density clusters and population centers to aid precinct planning.
Voters by Voting Method (November 2024)
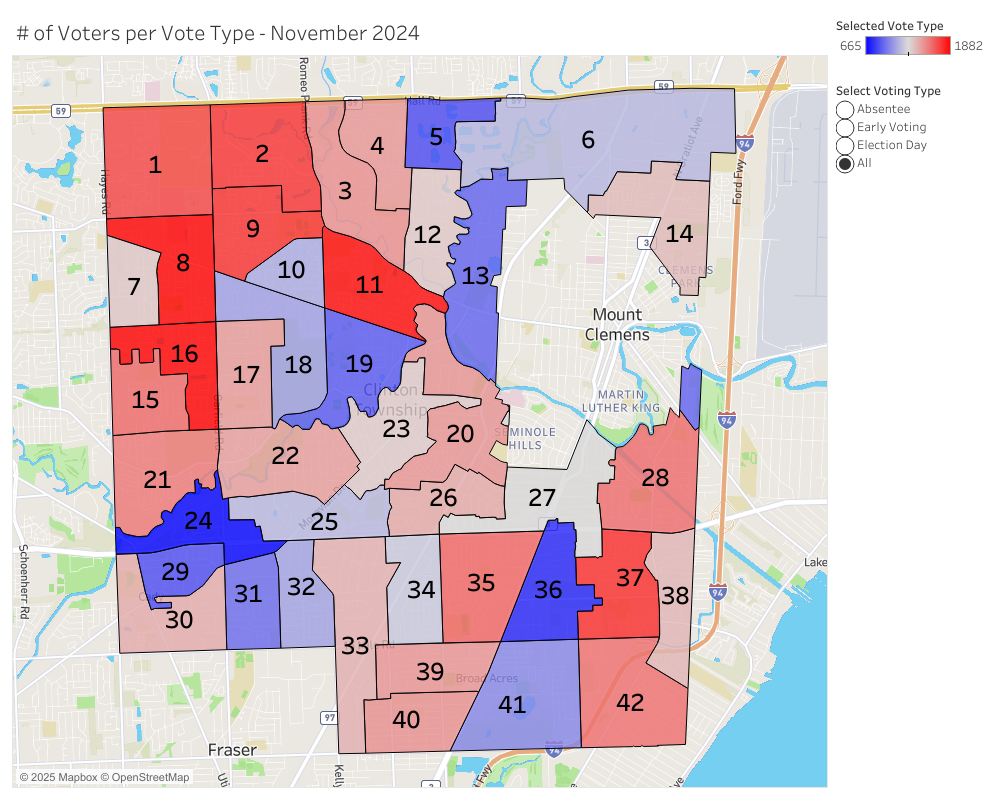
This dashboard breaks down voter participation by method — Early Voting, Absentee/Mail, and Election Day In-Person — for the November 2024 General Election.
It provides clear comparisons of participation methods and trends in voter behavior across the township.
Tools Used
- Tableau Public — interactive data visualization and publishing
- Excel & Python (pandas) — data cleaning and preprocessing
- ArcGIS precinct shapefiles — geospatial data integration for mapping
Author
Matthew Cheung
cheung12@msu.edu
LinkedIn